Demand is a fundamental concept in economics that directly influences the financial and operational decisions of accountancy professionals in Kenya. Understanding demand enables accountants to interpret market signals, forecast revenues, and advise businesses on pricing and production strategies. For instance, an accountant at a retail firm in Nairobi must grasp how consumer demand changes with income levels or price variations to prepare accurate financial projections. This chapter explores the concept of demand as it applies to market analysis, equipping accountancy students with practical insights critical for strategic decision-making.
2.1 Meaning of Terms Demand in Market
Grasping the terminology related to demand is essential for accountants who analyze market behaviors and contribute to business planning. The terms associated with demand clarify how consumer preferences and economic factors shape purchasing patterns. This section breaks down the key terms that define demand in market analysis, offering a solid foundation for applying demand concepts in accounting contexts such as budgeting, financial reporting, and investment appraisal.
2.1.1 Demand: Definition and Core Attributes
Demand refers to the quantity of a good or service that consumers are willing and able to purchase at various prices over a given period. For accountancy professionals, understanding demand involves recognizing both the willingness and the purchasing power of buyers, which affects revenue forecasts and cost management. Demand is not static; it varies with price, consumer income, tastes, and expectations, all of which must be considered when analyzing financial data.
Characteristics of Demand
- Price Sensitivity: Demand typically decreases as prices rise, reflecting consumer responsiveness to price changes. An accountant advising a supermarket chain must consider how price adjustments on staple goods affect overall sales volumes.
- Income Effect: Changes in consumers' income levels influence their ability to buy goods. For example, a SACCO accountant analyzing loan repayment trends may link increased demand for loans to rising household incomes.
- Substitutability: Availability of alternative products affects demand for a specific item. In financial services, if a bank offers better interest rates, it may attract more customers, reducing demand for competitors.
- Time Period: Demand fluctuates over different time frames; seasonal demand peaks can impact cash flow management in hospitality businesses.
- Market Size: The number of potential buyers defines total demand. An accountant working with a cooperative must assess the demographic growth to project future demand for agricultural inputs.
2.1.2 Demand Curve and Demand Schedule in Market Analysis
The demand schedule and the demand curve are two presentations of the same information. The schedule is a table listing the quantity demanded at each price. The curve is that same table plotted on a graph. An accountant works with both: the schedule feeds the sales budget and the curve shows at a glance what a proposed price change will do to volume.
The Demand Schedule
A supermarket branch in Nakuru records how many 2 kg packets of maize flour it sells in a week at each of six price points. The result is a demand schedule.
| Point |
Price (KSh per packet) |
Quantity demanded (packets per week) |
| A |
220 |
200 |
| B |
200 |
300 |
| C |
180 |
400 |
| D |
160 |
500 |
| E |
140 |
600 |
| F |
120 |
700 |
Reading the table from top to bottom, every drop of KSh 20 in price adds 100 packets to weekly sales. That constant relationship can be written as an equation:
Quantity demanded = 1300 − 5 × Price
Checking the equation against point A: 1300 − (5 × 220) = 1300 − 1100 = 200 packets, which matches the table. Checking against point F: 1300 − (5 × 120) = 1300 − 600 = 700 packets, which also matches. The figure 5 is the slope, meaning each KSh 1 reduction in price brings 5 extra packets of weekly sales.
The Demand Curve
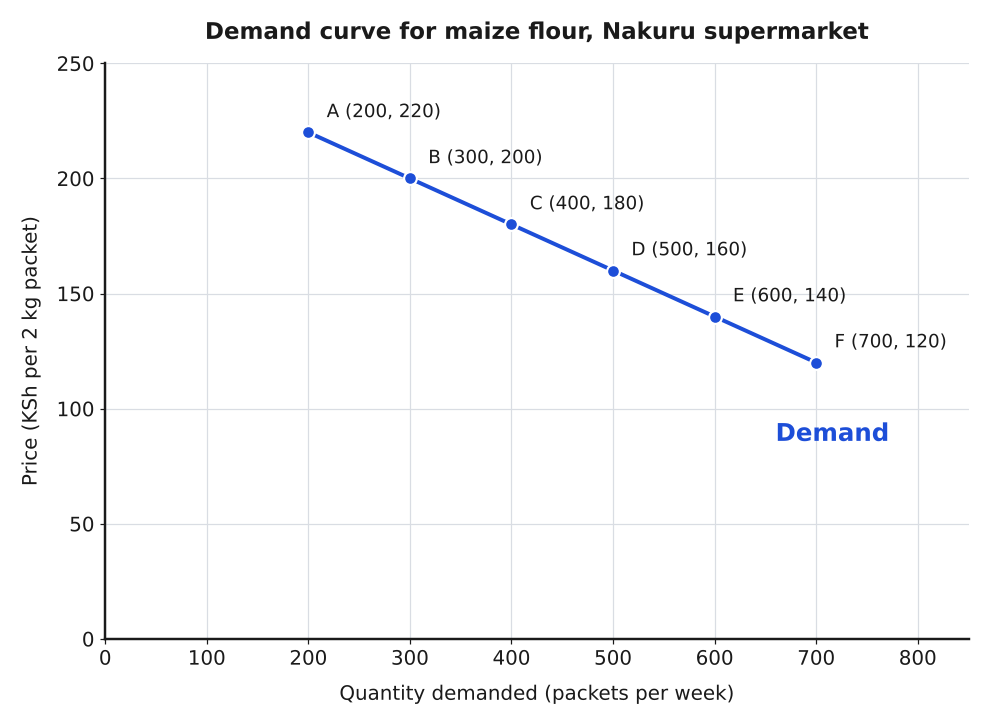
Figure: he six points of the demand schedule plotted as a demand curve. Price is on the vertical axis and quantity demanded on the horizontal axis.
Note the convention, which is the opposite of the usual mathematical practice: price goes on the vertical axis even though it is the cause, and quantity on the horizontal axis even though it is the effect. Every demand curve you meet in CDACC assessments and in published market reports follows this arrangement.
How to Plot a Demand Curve
- Draw the two axes. Label the vertical axis Price and the horizontal axis Quantity demanded, each with its unit.
- Choose a scale for each axis that covers the full range in the schedule without cramping the points.
- Plot each row of the schedule as a point, reading the price up the vertical axis and the quantity across the horizontal axis.
- Join the points with a smooth line.
- Label the line D or Demand, and give the whole diagram a title stating the product and the market.
Reading the Curve for Revenue
The schedule becomes a financial tool once total revenue is calculated at each price, since total revenue is price multiplied by quantity.
| Price (KSh) |
Quantity (packets) |
Total revenue (KSh) |
| 220 |
200 |
44 000 |
| 200 |
300 |
60 000 |
| 180 |
400 |
72 000 |
| 160 |
500 |
80 000 |
| 140 |
600 |
84 000 |
| 120 |
700 |
84 000 |
Two results in that table matter to an accountant.
First, cutting the price from KSh 200 to KSh 160 raises revenue from KSh 60 000 to KSh 80 000, an increase of KSh 20 000, which is 20 000 ÷ 60 000 = 0.3333, or 33.3 per cent. The price cut pays for itself in volume.
Second, cutting the price further from KSh 140 to KSh 120 leaves revenue unchanged at KSh 84 000 even though 100 extra packets are sold each week. Those extra packets carry extra purchase cost, extra handling and extra shelf space, so the branch is working harder for the same money and earning less profit. This is the point at which further price cutting stops helping.
The highest revenue on this curve lies between those two prices. Writing total revenue as a formula:
Total revenue = Price × (1300 − 5 × Price) = 1300P − 5P²
This reaches its maximum where 1300 − 10P = 0, giving P = 130. At that price the quantity is 1300 − (5 × 130) = 650 packets, and total revenue is 130 × 650 = KSh 84 500. Any price above or below KSh 130 earns less.
Movement Along the Curve Against a Shift of the Curve
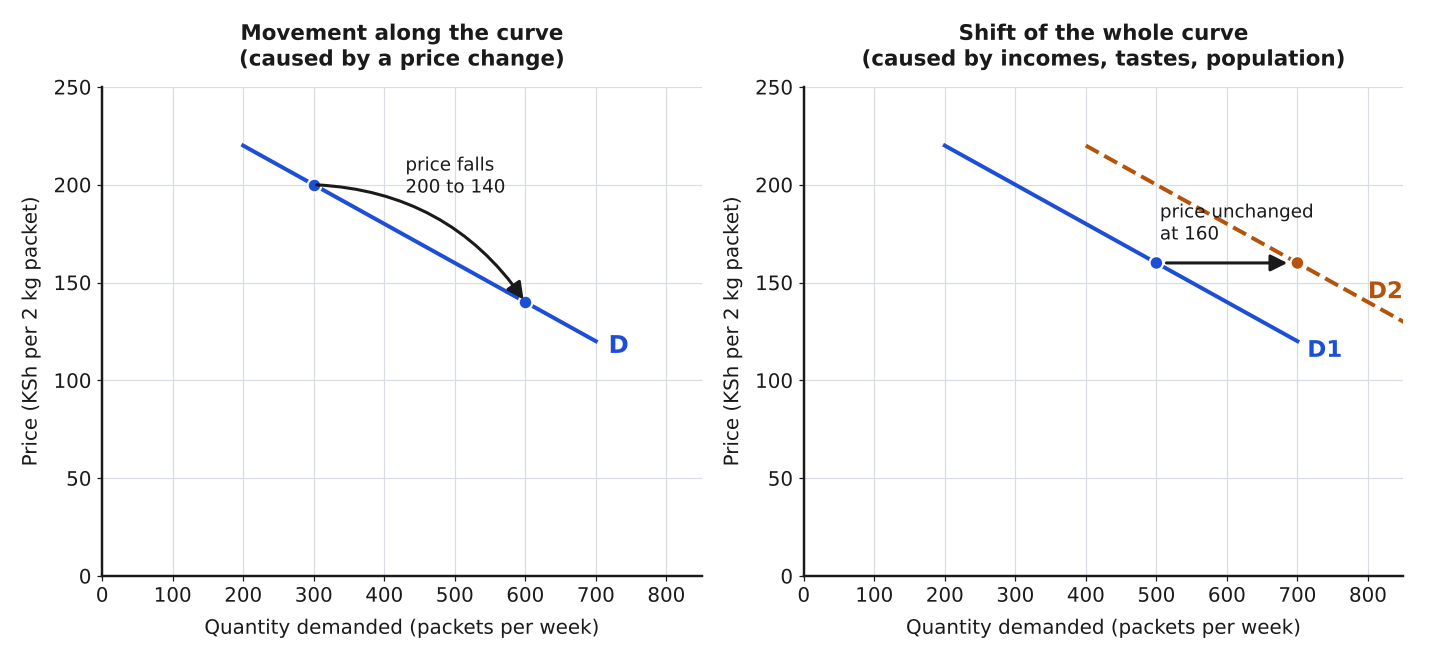
Figure: A movement along the curve, caused by a price change, compared with a shift of the whole curve, caused by a change in any other determinant.
The distinction decides how an accountant explains a change in sales volume.
- A movement along the curve happens when the price changes and nothing else does. In the left panel the price falls from KSh 200 to KSh 140, so weekly sales rise from 300 to 600 packets. The curve itself has not moved. The business caused this change, through its own pricing decision.
- A shift of the curve happens when a determinant other than price changes: incomes, tastes, population, the price of a substitute. In the right panel the whole curve moves right to D2, so at the unchanged price of KSh 160 weekly sales rise from 500 to 700 packets. The business did not cause this change, and the old schedule is now out of date.
This matters in a variance report. If sales volume rises after the branch cut its price, the variance is explained by the pricing decision and the old schedule still holds. If sales volume rises with no price change, the schedule itself must be rebuilt before it is used for next period's budget.
Components of the Demand Curve and Schedule
- Price Axis: Vertical axis showing different price levels. Accountants use this to evaluate how price changes impact revenue.
- Quantity Axis: Horizontal axis indicating quantity demanded. It assists in forecasting sales volume.
- Downward Slope: Reflects the inverse relationship between price and demand. For instance, a county hospital's procurement officer may note reduced demand for certain medical supplies when prices increase.
- Data Points: Each point on the curve corresponds to quantity demanded at a specific price, informing budgeting and inventory decisions.
- Shifts versus Movements: Movements along the curve occur due to price changes, while shifts result from factors like income or preferences, which accountants must distinguish when analyzing market trends.
2.1.3 Determinants of Demand Relevant to Accountancy Practice
Demand is influenced by several factors beyond price, each holding significance for accountants engaged in market and financial analysis. Identifying these determinants allows accountants to anticipate changes in demand that affect sales forecasts, cost control, and profitability assessments.
Key Determinants of Demand
- Consumer Income Levels: Higher incomes generally increase demand for normal goods, influencing revenue projections in sectors like education or retail.
- Consumer Preferences and Tastes: Shifts in consumer tastes can affect product demand, impacting inventory valuation and marketing budgets for businesses such as hotels.
- Prices of Related Goods: The demand for a product can increase or decrease depending on the prices of substitutes or complements, affecting cross-product financial analysis in banking or insurance.
- Expectations of Future Prices: Anticipation of price rises may lead to increased current demand, which accountants must consider in cash flow and working capital management.
- Population and Demographics: Changes in population size or structure affect market demand, critical for long-term financial planning in sectors like healthcare or agriculture.
Each of these determinants shifts the whole demand curve, as shown in Figure 2.1.2b. None of them moves a business along its existing curve: only a price change does that.
2.1.4 Law of Demand and Its Exceptions in Market Context
The law of demand states that, ceteris paribus, quantity demanded falls as price rises and vice versa. This principle guides pricing and sales strategies, but accountants must also recognize exceptions where demand does not follow this pattern, ensuring accurate market analysis and financial reporting.
Exceptions to the Law of Demand
- Giffen Goods: Some inferior goods may see increased demand as prices rise due to their necessity, a scenario relevant when analyzing low-income consumer behavior in rural cooperatives.
- Veblen Goods: Luxury items may experience higher demand with higher prices because of their status symbol value, impacting revenue forecasts for premium product lines.
- Speculative Demand: Expectations of future price increases can cause demand to rise even as prices increase, affecting investment decisions in sectors like real estate.
- Essential Goods: Demand for necessities such as basic foodstuffs or medications tends to be inelastic, a factor crucial for budgeting in public health institutions.
- Quality Perceptions: Sometimes higher prices are associated with better quality, leading to increased demand, which accountants must factor into pricing analyses for branded products.
Where an exception applies, the demand curve for that good slopes upward from left to right rather than downward, and a schedule built on the normal assumption will understate sales at higher prices.
Practice Questions
- Define demand and explain five key characteristics that influence demand in the Kenyan market. (10 marks)
- Illustrate the concept of a demand curve and explain how it is useful for an accountant in a retail business. (8 marks)
- Identify and discuss five determinants of demand and their significance in financial planning for a SACCO. (10 marks)
- Explain the law of demand and describe three exceptions that an accountant should be aware of when analyzing market data. (12 marks)
The rest of this chapter
🔒Create a free account to open more of this chapter.
Free: practical guides, quick cards, workplace scenarios and more.
Create a free account 🔒2.2 Individual Demand versus Market Demand
In the Kenyan accountancy profession, understanding the distinction between individual demand and market demand is vital for accurate market analysis and forecasting. Accountants working in firms, insurance companies, or financial institutions often analyze de…
🔒2.3 Factors influencing demand
In the Kenyan accountancy profession, understanding the factors influencing demand is crucial for accurate market analysis. Accountants advising businesses must appreciate how changes in these factors affect the demand for goods and services, including financi…
🔒2.4 Exceptional demand curves reports
In the context of accountancy professionals in Kenya, especially those involved in market analysis, understanding exceptional demand curves is essential for accurate financial forecasting and strategic planning. Exceptional demand curves deviate from the stand…
🔒2.5 Types of Demand
In the context of accountancy professionals in Kenya, understanding the various types of demand is essential for accurate market analysis, financial forecasting, and strategic decision-making. Demand types influence how accountants assess consumer behaviour, p…
🔒2.6 Movement along and shifts of demand curves
Understanding how demand changes in response to various factors is crucial for accountancy professionals engaged in market analysis and financial forecasting. In Kenya, accountants working with retail businesses, banks, or cooperative societies must accurately…
🔒2.7 Elasticity of demand
Elasticity of demand is a critical concept for accountancy professionals involved in market analysis and financial planning. Understanding how the quantity demanded of goods or services responds to changes in price, income, or other factors enables accountants…
🔒2.8 Types of elasticity: price, income and cross elasticity
In the field of accountancy, particularly within Kenyan markets, understanding the responsiveness of demand to various economic factors is essential for accurate financial forecasting, budgeting, and strategic planning. Elasticity measures how sensitive the qu…
🔒2.9 Measurement of elasticity; point and arc elasticity
In the Kenyan accountancy profession, understanding how demand responds to changes in price or income is essential for financial analysis, budgeting, and advising clients on pricing strategies. Elasticity measurement allows accountants to quantify the sensitiv…
🔒2.10 Factors influencing elasticity of demand
Understanding the factors that influence the elasticity of demand is crucial for accountancy professionals engaged in market analysis and financial forecasting. In Kenya's dynamic economic environment, where consumer behavior is shaped by varying income levels…
🔒2.11 Application of elasticity of demand in management and economic policy decision making
The concept of elasticity of demand plays a crucial role in the decision-making processes of accountancy professionals within Kenyan businesses and government agencies. Understanding how quantity demanded responds to changes in price or other factors enables m…
Chapter Summary
This chapter explored the concept of demand in the market, clarifying its meaning and distinguishing between individual demand and market demand analysis. It examined the various factors that influence demand, including income levels, tastes, and prices of related goods. The discussion included exceptional demand curves that deviate from the typical downward slope, highlighting unique market behaviors. Different types of demand were outlined to provide a comprehensive understanding of consumer purchasing patterns. The chapter also explained the difference between movements along the demand curve and shifts of the entire curve, emphasizing their causes. The concept of elasticity of demand was introduced, followed by an analysis of its types: price elasticity, income elasticity, and cross elasticity. Methods for measuring elasticity, such as point elasticity and arc elasticity, were detailed, along with the factors that affect elasticity in different markets. Finally, the chapter demonstrated how elasticity of demand informs management strategies and economic policy decisions, enabling more effective responses to market changes.
Self-Assessment
🔒 PDFDownload this self-assessment, with answers
A. Written Assessment
- Define the term demand in the context of market analysis. (3 marks)
- Differentiate between individual demand and market demand with examples relevant to the accounting profession. (4 marks)
🔒20 more in this section.
Chapter Examination Questions
🔒 PDFDownload these examination questions, with worked answers
SECTION A (40 Marks) - Answer ALL Questions
- Define the term demand as used in market analysis, illustrating your answer with an example from the Kenyan banking sector. (4 marks)
- Differentiate between individual demand and market demand using examples relevant to the retail accounting services industry in Nairobi. (4 marks)
🔒18 more in this section.
