
By the end of this chapter, you will be able to:
Mastering these skills will help you create precise and reliable maps, which are essential for successful projects in the cartography trade.
Cartographic map production is a fundamental skill for land survey professionals in Kenya, enabling them to transform raw geospatial data into accurate, readable maps that support land management, planning, and development. This chapter explores how diverse raw data types are integrated and processed to produce reliable cartographic products. Understanding the nature and handling of base maps, coordinates, distances, aerial photographs, satellite imagery, bearings, and reduced levels is essential for delivering precise maps that comply with national standards and client requirements.
Raw data in land surveying refers to the initial measurements and observations collected in the field or obtained from remote sensing platforms before any processing or interpretation. This raw data forms the foundation upon which maps are constructed, requiring careful handling and transformation to ensure spatial accuracy and usability. In Kenya, surveyors working for county governments, land registries, or private firms must handle various raw data types to produce cadastral and topographic maps that support land allocation, infrastructure development, and environmental management.
The base map serves as the foundational layer in cartographic production, providing essential geographic context and reference points for overlaying additional data. It typically includes features such as roads, rivers, boundaries, and landmarks, which are critical for orientation and spatial relationships.
Base maps in Kenya are often sourced from government agencies like the Survey of Kenya or downloaded from platforms such as the Kenya Open Data Portal. Surveyors may also generate their own base maps from previous surveys or digitize paper maps for integration with new data.
Base maps provide the spatial framework for plotting survey points, boundaries, and features. For example, in land adjudication projects, base maps assist in overlaying parcel boundaries for verification against field measurements.
Digitizing paper base maps involves scanning and georeferencing them to coordinate systems such as UTM Zone 37S used in Kenya. This process ensures compatibility with GPS and GIS datasets.
Coordinates with oral refer to the spatial positioning data obtained and communicated during field surveys, often involving verbal transmission of coordinate values. This practice is especially relevant in collaborative surveying exercises or when relaying data between field teams and office personnel.
Coordinates denote the precise location of points on the earth's surface, usually expressed in a coordinate system such as UTM or geographic latitude and longitude. They enable accurate plotting of land features and boundaries on maps.
In many Kenyan survey projects, especially in remote or informal settlements, surveyors rely on oral communication to share coordinate data due to limited digital infrastructure or challenging terrain. This requires clarity, accuracy, and verification to avoid transcription errors.
Noise, language barriers, and unclear articulation can lead to errors. Employing standardized coordinate formats and training field teams in communication protocols improves reliability.
Distances represent the linear measurements between two points on the ground, fundamental for establishing boundaries and features in land surveying. Accurate distance measurement underpins the precision of maps and cadastral records.
Distances are measured using a variety of instruments including tape measures, electronic distance measurement (EDM) devices, and total stations. Each technique offers different levels of accuracy and efficiency suited to specific survey contexts.
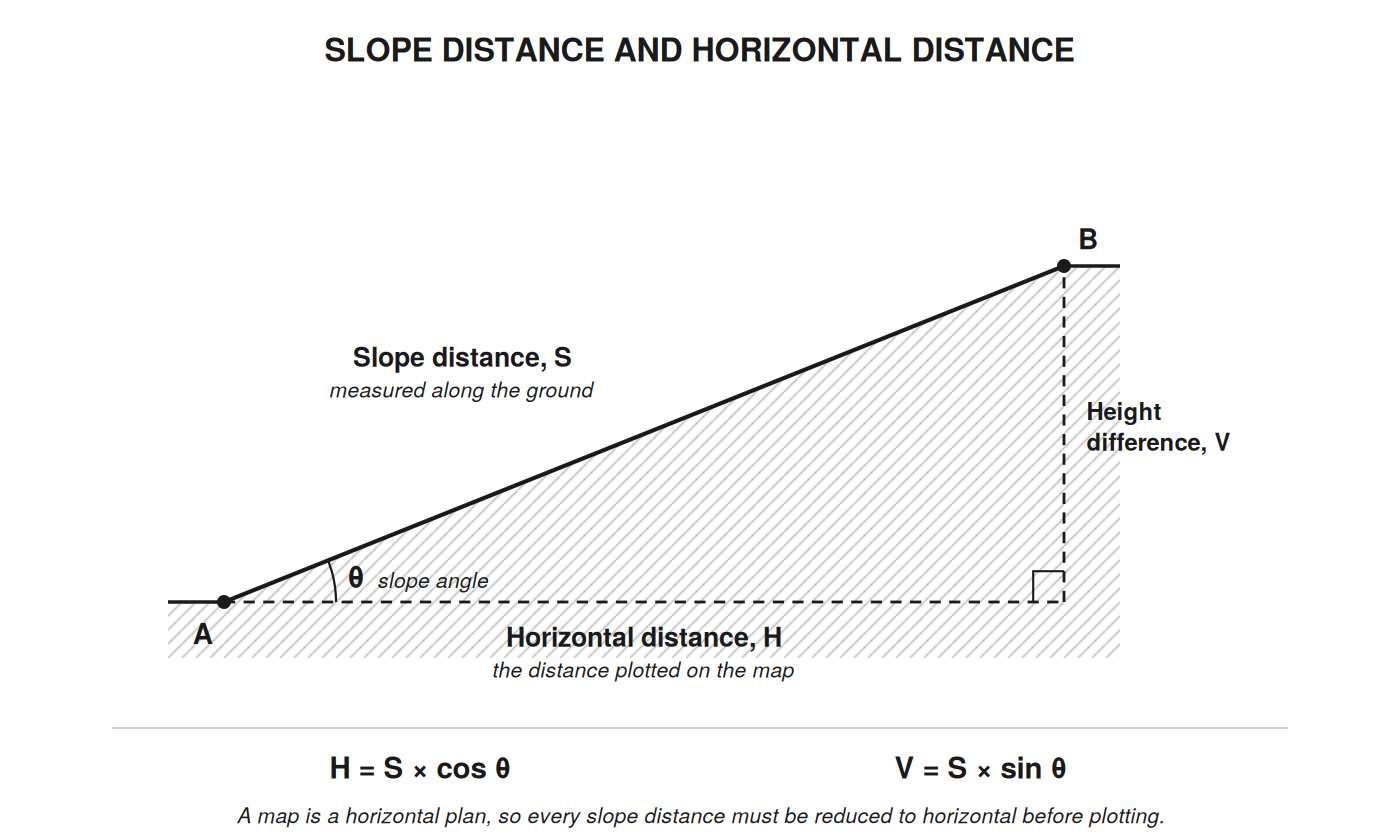
Figure: slope distance.
In Kenyan terrain, slope corrections are necessary where steep gradients occur. Where the slope angle θ is measured:
Example. A slope distance of 100.00 m is measured along ground rising at 10°.
Plotting the 100.00 m directly would place point B 1.52 m too far away on the map.
Distances are typically recorded in meters in Kenya, aligning with the metric system used in surveying standards. Consistent units prevent errors in data integration and map scaling.
Precise distance measurements define property boundaries clearly, preventing disputes and facilitating legal land transactions.
Aerial photographs are images captured from aircraft or drones, providing a bird's-eye view of the terrain. They are invaluable in mapping large areas quickly and detecting features not easily accessible on foot.
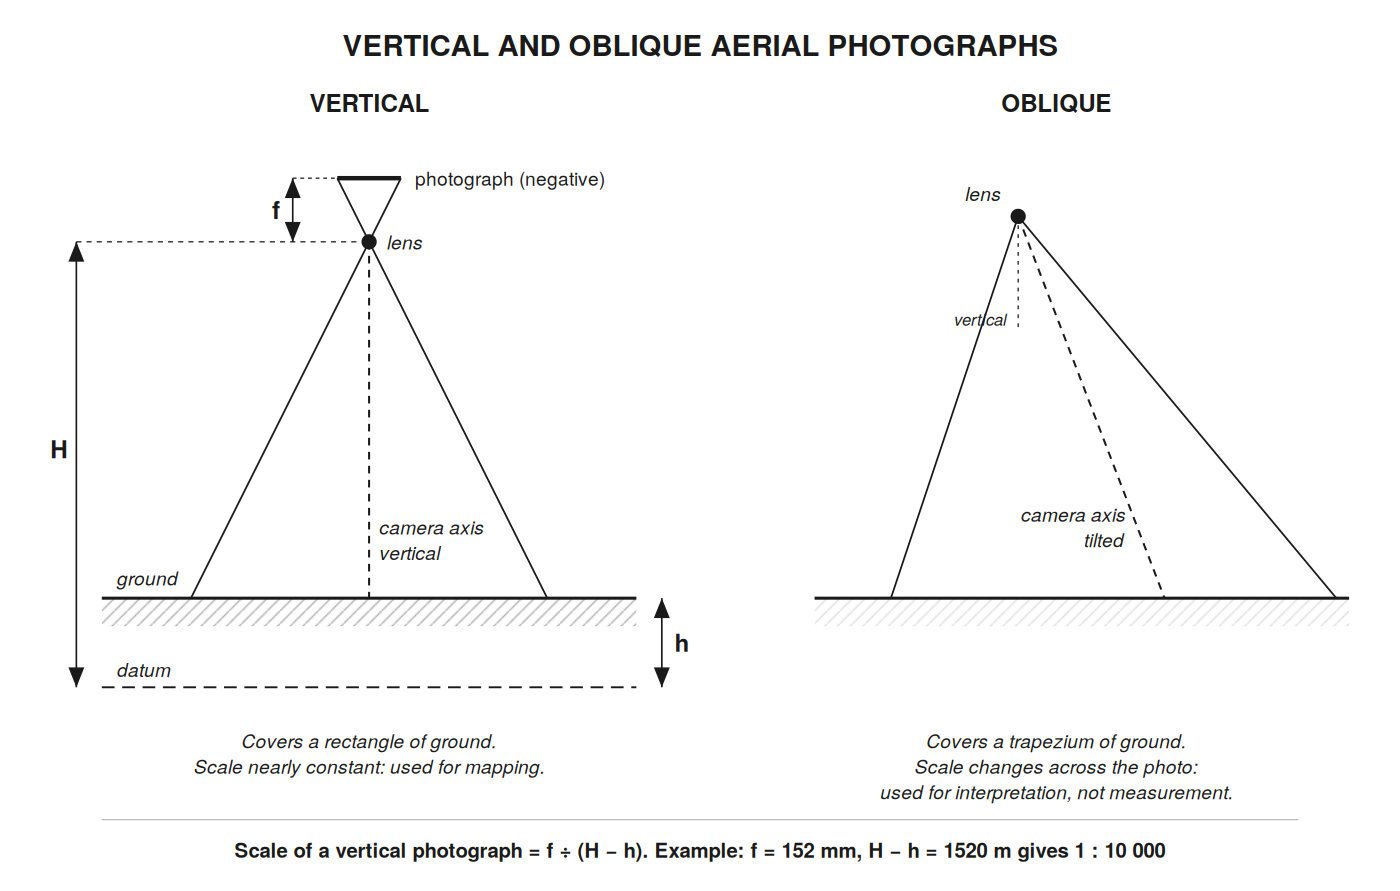
*Figure: aerial photographs.
Surveyors use aerial photographs to identify landforms, vegetation, water bodies, and infrastructure. For example, in agricultural cooperatives, aerial photos help map farm boundaries and crop patterns.
The scale of a vertical photograph depends on the focal length of the camera and the height of the camera above the ground:
Scale = f ÷ (H − h)
where f is the focal length of the camera, H the flying height above datum, and h the height of the ground above datum. Both must be in the same units.
Example. A camera of focal length 152 mm is flown at 2020 m above datum over ground at 500 m above datum.
Because h varies with the terrain, the scale of a photograph over hilly ground varies from point to point. Higher resolution images support detailed feature extraction.
Using stereo pairs of aerial photographs, surveyors can derive three-dimensional information such as contours and elevations, enhancing map accuracy.
Cloud cover, shadows, and seasonal changes affect photo clarity. Surveyors plan aerial photography missions during optimal weather conditions to ensure quality data capture.
Satellite imagery offers extensive spatial coverage and frequent updates, making it a powerful tool for land surveyors in Kenya. It complements aerial photographs by covering inaccessible areas and providing multispectral data.
Platforms such as Sentinel, Landsat, and commercial providers like Maxar (formerly DigitalGlobe) supply imagery accessible to Kenyan surveyors. Government agencies also provide free or subsidized data for development projects.
Techniques such as image enhancement, classification, and georeferencing prepare satellite images for integration into GIS and cartographic products.
Satellite imagery supports land cover mapping, change detection, and environmental monitoring. County governments use it to update cadastral boundaries and monitor urban expansion.
Cloud cover and atmospheric disturbances can obscure features. Additionally, the spatial resolution may limit detail for small-scale surveys, requiring integration with ground data.
Bearings indicate the direction from one point to another, expressed as angles relative to a reference direction, usually north. They are critical in defining boundary orientations and navigating survey traverses.
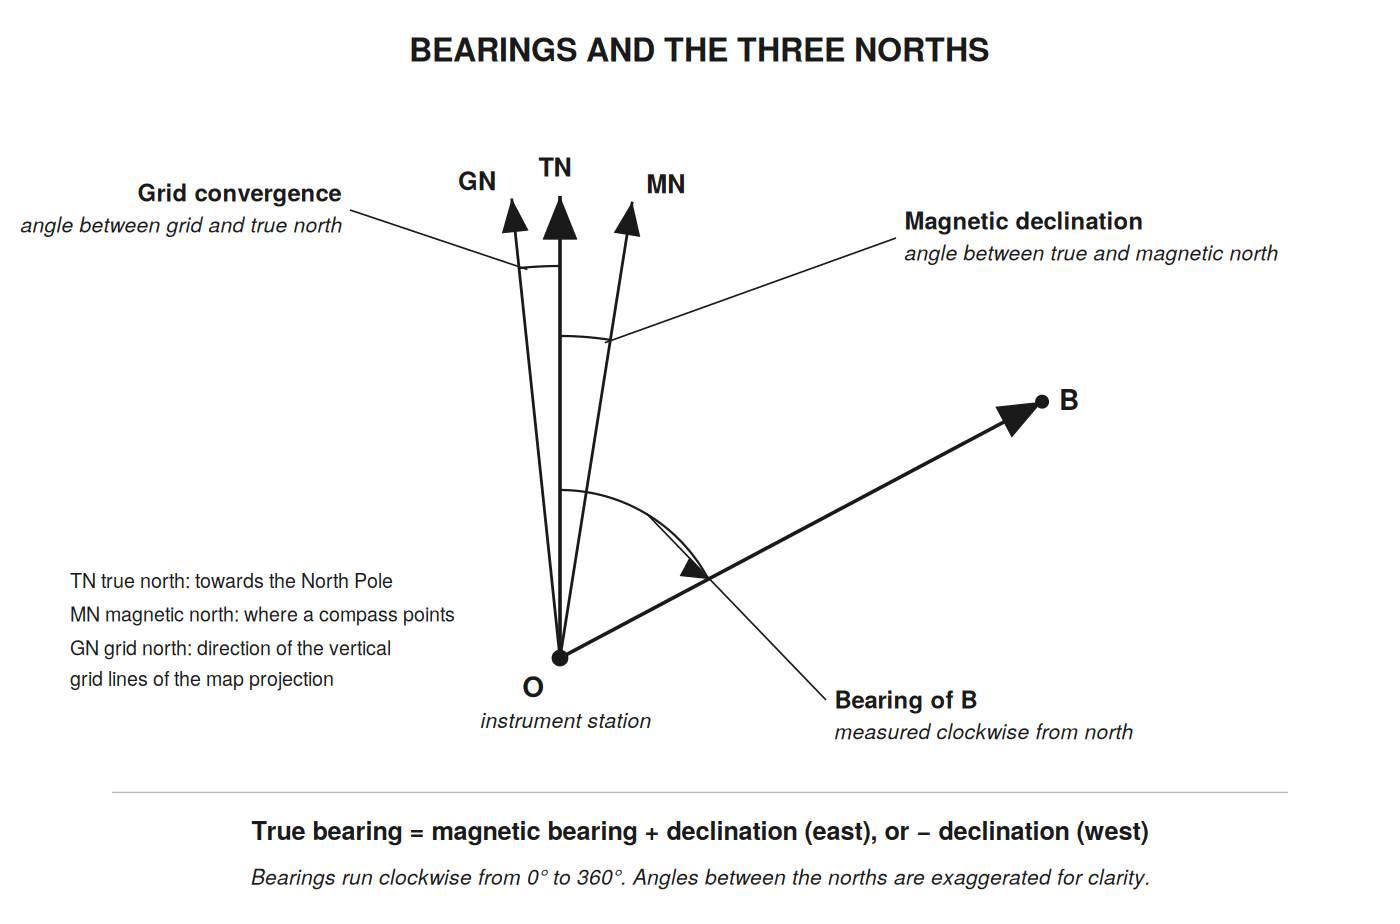
Figure: bearings three norths.
A whole circle bearing is measured clockwise from north, from 0° to 360°. North is 0°, east 90°, south 180° and west 270°. The back bearing, the direction from B back to O, differs by exactly 180°: add 180° if the bearing is less than 180°, subtract 180° if it is more.
Surveyors use compasses, theodolites, or total stations to measure bearings accurately. Calibration against known reference points ensures precision.
Bearings combined with distances define property lines clearly in legal descriptions and survey plans.
Bearings are recorded in degrees, minutes, and seconds, and must be consistently reported in survey documentation, stating which north they refer to, to avoid ambiguity.
Reduced levels (RLs) represent the vertical height of points relative to a chosen datum, essential for representing terrain elevations and planning construction works.
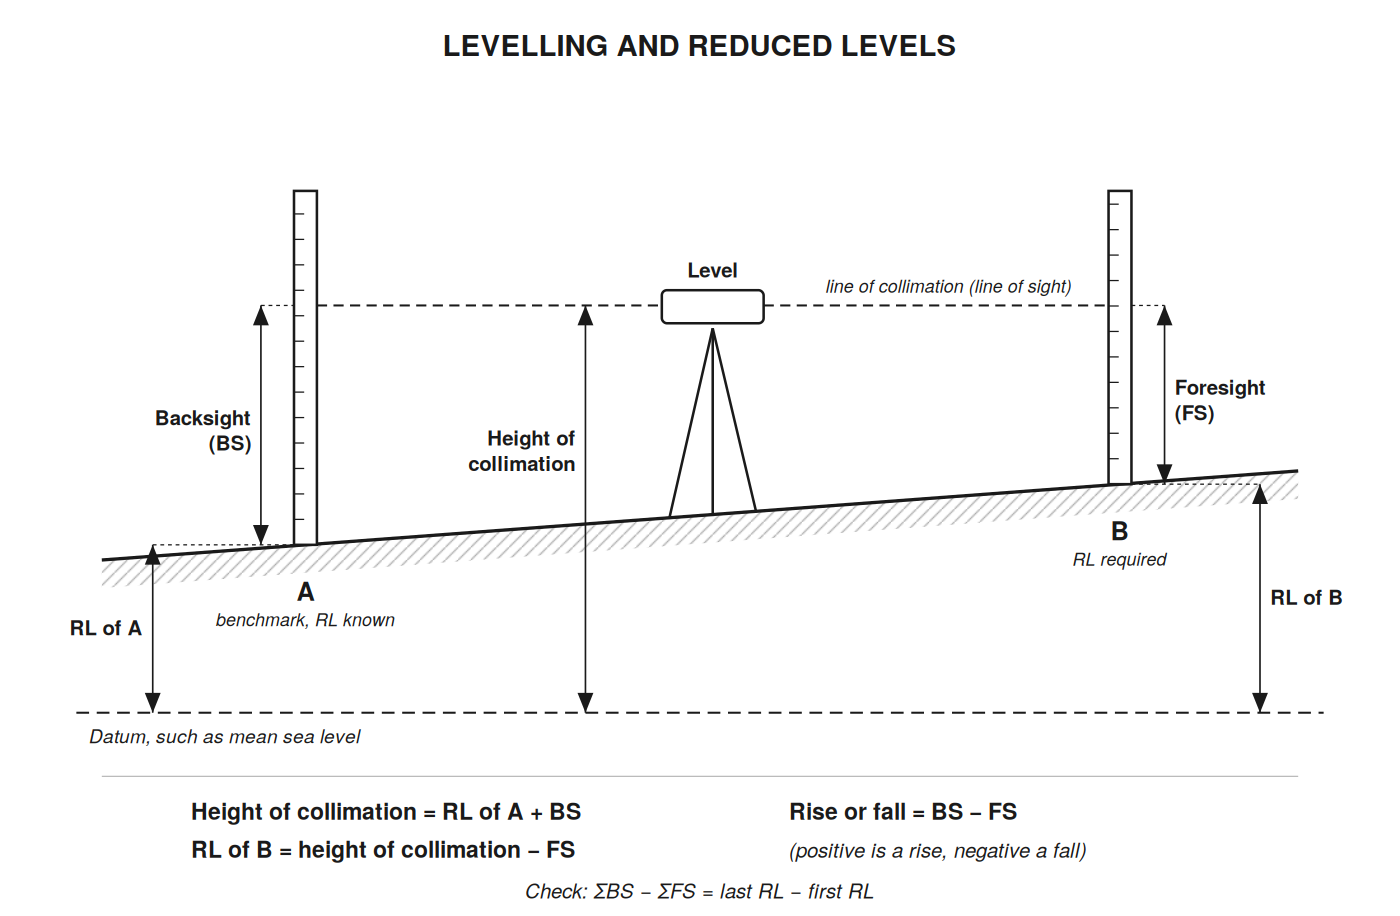
Figure: levelling reduced levels.
RLs express the elevation of survey points after adjusting raw height measurements to a common reference, often mean sea level. Levelling always starts from a benchmark, a fixed point whose RL is already known.
Example. A benchmark A has RL 1520.450 m. The backsight on A reads 1.235 m and the foresight on B reads 0.870 m.
RL data enables the creation of contour lines and slope analysis on topographic maps, supporting infrastructure design such as road gradients.
Instrument misleveling, staff reading mistakes, a staff not held vertical, and datum inconsistencies cause RL errors. Systematic checks and repeated measurements improve reliability. Keeping backsight and foresight distances roughly equal cancels most errors caused by the level not being perfectly adjusted.
Explain the significance of a base map in land survey cartography and describe five essential characteristics it must possess. (10 marks)
Discuss the challenges faced when transmitting coordinate data orally during field surveys and outline five methods to mitigate these challenges. (10 marks)
Differentiate between slope distance and horizontal distance in surveying and explain the process of converting slope distance to horizontal distance with a formula. (10 marks)
Describe the different types of aerial photographs used in land surveying and explain their specific applications. (10 marks)
Outline five key applications of satellite imagery in land surveying within the Kenyan context. (10 marks)
Define bearings and explain the importance of correcting magnetic bearings for declination in Kenya. (10 marks)
Describe the rise and fall method for calculating reduced levels and explain its significance in producing topographic maps. (10 marks)
Create a free account to open more of this chapter.
Free: practical guides, quick cards, workplace scenarios and more.
Create a free accountThis chapter explored the foundational elements of cartographic map production, beginning with the collection of raw data including base maps, coordinates, distances, aerial photographs, satellite imagery, bearings, and reduced levels processing data. The subsequent step involved processing this raw data to ensure accuracy and usability for mapping purposes. Georeferencing was then covered as a critical process to align spatial data with real-world coordinates, enabling precise map creation. Various types of maps and plans were examined, such as RIM, topographic, atlas, deed plans, thematic, geological, and cadastral maps, each serving unique purposes in spatial representation. The concept of map scale was detailed with distinctions among large, small, and medium scales, alongside methods of scale representation including graphical, representative fraction, and statement forms. Finally, the chapter addressed the production phase where all designed elements are compiled into the final map product ready for practical application. This comprehensive overview equips students with the principles necessary for effective cartographic map production.
At the start of this chapter we promised you would be able to:
Tick each one you can genuinely do.
So, are you there yet?
You're competent when you can confidently do 50% or more of what this chapter promised.
Sign in to record how you're doing.